Image Details
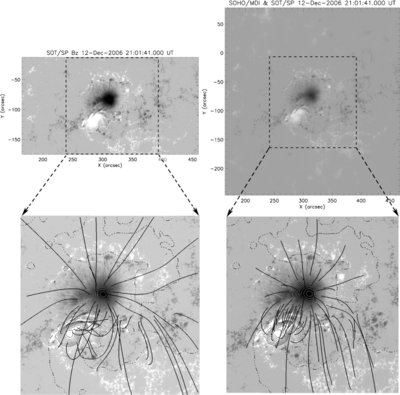
Caption: Figure 2.
Top left: the FOV of the magnetic field observed by SOT/SP from 20:30 to 21:33 UT on 2006 December 12. The dashed square denotes the FOV in which the NLFFF extrapolation is performed. Bottom left: the three-dimensional magnetic field extrapolated by the NLFFF model for the dashed square shown in the top left panel. Top right: the FOV of MDI magnetogram for potential field extrapolation observed at 20:51 UT on 2006 December 12. The dashed square is the similar to that in the top left panel. Bottom right: the three-dimensional magnetic field extrapolated by the potential field model. Note that only the region in the dashed square is shown.
Other Images in This Article
Copyright and Terms & Conditions
© 2009. The American Astronomical Society. All rights reserved.