Image Details
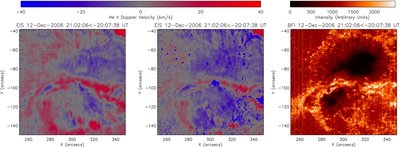
Caption: Figure 1.
EIS He ii 256 Å velocity maps fitted by a single Gaussian curve (left panel) and double Gaussian curves (middle panel). The velocities that exceed 40/ −40 km s −1 have been set to the top color (red/blue) in order to make the velocity field pattern stand out. The Ca ii H image (right panel) shows that it has similar configurations with the He ii 256 Å velocity maps. The Ca ii H image observed by SOT/BFI is created artificially to match the EIS map in time. See text for details.
Other Images in This Article
Copyright and Terms & Conditions
© 2009. The American Astronomical Society. All rights reserved.
Copyright ©
2025 Astronomy Image Explorer. All Rights Reserved.