Image Details
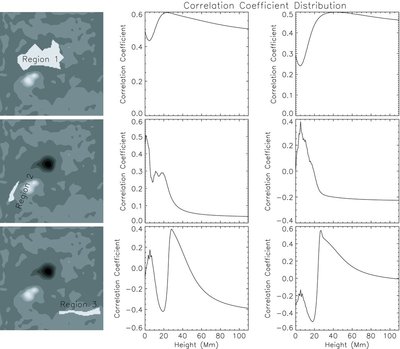
Caption: Figure 4.
Height distributions of the correlation coefficient for the He ii 256 Å line in different subregions of the active region NOAA 10930. The white polygons labeled with Regions 1–3 (left column) show the areas selected to calculate the correlation coefficients. The distributions in the middle and right columns are calculated by correlating the magnetic field inclination with the Doppler velocity, which is obtained by single and double Gaussian curve fitting, respectively. The distributions in top to bottom rows are obtained in Regions 1–3, respectively.
Other Images in This Article
Copyright and Terms & Conditions
© 2009. The American Astronomical Society. All rights reserved.
Copyright ©
2025 Astronomy Image Explorer. All Rights Reserved.