Image Details
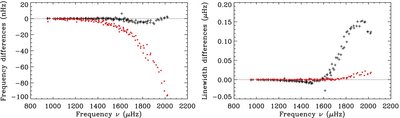
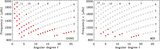
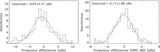
Caption: Figure 17.
Effect of asymmetry and spatial leaks on the fits. Left panel: differences (in nHz) in the 2088 day GONG frequencies estimated using different models to describe the m-averaged spectrum: symmetric Lorentzian profile minus asymmetric Lorentzian profile (Equation (2)) both models including the first δ m ± 2 spatial leaks, i.e., S2 minus A2 (red dots); both asymmetric Lorentzian profiles (Equation (2)) but ignoring the closest δ m ± 2 spatial leaks for one of them, i.e., A minus A2 (black plus signs). The differences in the extracted frequencies using different fitting profiles are represented as a function of frequency. Right panel: same as the left panel, but for the differences (in μHz) in the fitted mode linewidths.
Other Images in This Article
Show More
Copyright and Terms & Conditions
© 2009. The American Astronomical Society. All rights reserved.