Image Details
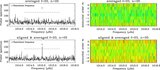
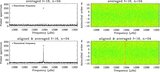
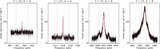
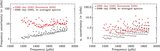
Caption: Figure 8.
Left panel: histogram of the differences (in nHz) in the estimated central frequencies between the 2088 day GONG data set using the m-averaged spectrum technique and the coeval 2088 day GONG Korzennik (2005)'s estimates. Right panel: histogram of the differences (in nHz) in the estimated frequencies between the 2088 day GONG and MDI data sets using the m-averaged spectrum technique in the sense GONG minus MDI. The corresponding Gaussian function fits and their associated mean values and standard deviations are also indicated.
Other Images in This Article
Show More
Copyright and Terms & Conditions
© 2009. The American Astronomical Society. All rights reserved.
Copyright ©
2025 Astronomy Image Explorer. All Rights Reserved.