Image Details
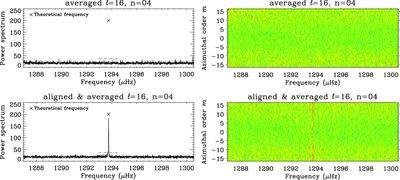
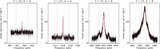
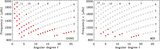
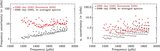
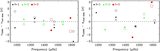
Caption: Figure 3.
Examples of m-averaged power spectra (left panels) before (top) and after (bottom) correcting for the shift coefficients in the case of the oscillation multiplet l = 16, n = 4 observed in 2088 days of GONG data. The corresponding m–ν diagrams are also shown (right panels). The crosses indicate the position of the corresponding theoretical central frequency calculated from Christensen-Dalsgaard's model S (Christensen-Dalsgaard et al. 1996). The dot-dashed lines on the left-hand side panels give the 10% probability limit that a peak is due to noise in the 238 windows, 1.5 μHz wide. The illustrated spectral window contains the 2 l + 1 components of the represented multiplet.
Other Images in This Article
Show More
Copyright and Terms & Conditions
© 2009. The American Astronomical Society. All rights reserved.