Image Details
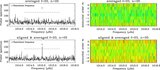
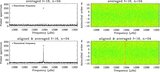
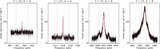
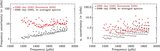
Caption: Figure 1.
 (left panel), natural logarithm of the mode linewidth (middle panel), and entropy (right panel) of the
m-averaged spectrum as a function of the shift coefficient
a
1 obtained from 10 simulated
l = 15 spectra. The vertical dashed lines represent the introduced value of
a
1 (400 nHz) in the simulations. The horizontal dotted-dashed line in the center panel represents the mode linewidth of the
simulated spectra, 0.4 μHz.
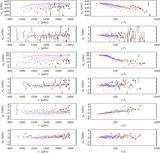
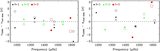
(left panel), natural logarithm of the mode linewidth (middle panel), and entropy (right panel) of the
m-averaged spectrum as a function of the shift coefficient
a
1 obtained from 10 simulated
l = 15 spectra. The vertical dashed lines represent the introduced value of
a
1 (400 nHz) in the simulations. The horizontal dotted-dashed line in the center panel represents the mode linewidth of the
simulated spectra, 0.4 μHz.
Other Images in This Article
Show More
Copyright and Terms & Conditions
© 2009. The American Astronomical Society. All rights reserved.
Copyright ©
2025 Astronomy Image Explorer. All Rights Reserved.