Image Details
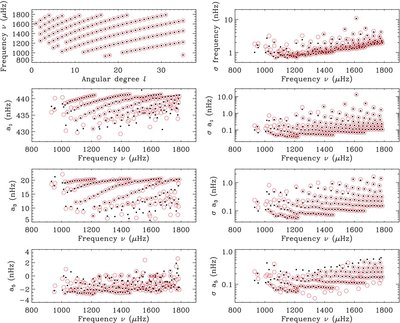
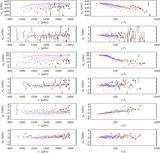
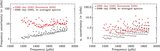
Caption: Figure 16.
Left column: l–ν diagram, and a 1, a 3, and a 5 splitting coefficients for the common, low-frequency p-modes measured in the 3960 day GONG data set obtained by using the maximum likelihood (circles) and the narrowest peak (dots) of the m-averaged spectrum as FOM to determine the best estimates of the a-coefficients (see Section 3.1 and Figure 1). Right column: associated 1σ formal uncertainties (nHz) of the mode central frequencies, and of the a 1, a 3, and a 5 splitting coefficients.
Other Images in This Article
Show More
Copyright and Terms & Conditions
© 2009. The American Astronomical Society. All rights reserved.
Copyright ©
2025 Astronomy Image Explorer. All Rights Reserved.