Image Details
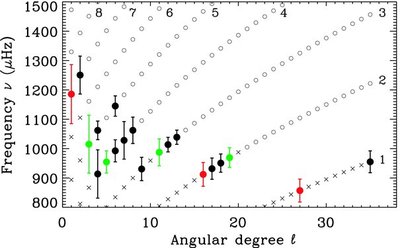
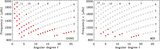
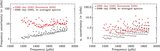
Caption: Figure 15.
l–ν diagram of the new low-frequency p-modes observed in spatially resolved data in the range of angular degrees 1 ⩽ l ⩽ 35 (black dots: observed in the 3960 day GONG data set; green dots: observed in the 2088 day GONG data set; red dots: modes observed in the 2088 day MDI data set). The corresponding frequency uncertainties were multiplied by 2 × 10 4. The already known modes are represented by the open circles, and the predicted modes by the crosses. The ridges of same radial order are also indicated from n = 1 to n = 8.
Other Images in This Article
Show More
Copyright and Terms & Conditions
© 2009. The American Astronomical Society. All rights reserved.
Copyright ©
2025 Astronomy Image Explorer. All Rights Reserved.