Image Details
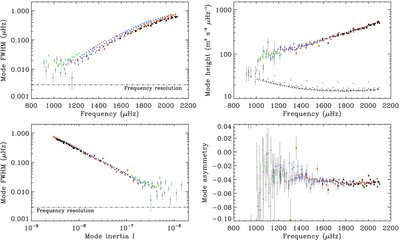
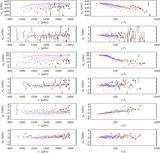
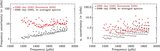
Caption: Figure 13.
Mode fwhm Γ n, l (upper left panel) and height H n, l (upper right panel) as a function of frequency for the low-frequency p-modes l ⩽ 35 extracted from 3960 days of GONG data with the m-averaged spectrum technique. The different colors and symbols correspond to selected ranges of radial-orders n: green triangles, modes with n = 1, 2; purple stars, n = 3, 4; blue upside-down triangles, n = 5, 6; orange squares, n = 7, 8; and black dots, n ⩾ 9. The frequency resolution of the analyzed data set is indicated on the upper left-hand side plot, and the fitted background level ( B n, l ) is also represented on the upper right-hand side plot (small black dots). Lower left panel: same as above, but for the mode fwhm Γ n, l as a function of the mode inertia ( I), calculated from Christensen-Daslgaard's model S (Christensen-Dalsgaard et al. 1996). The frequency resolution is also indicated. Lower right panel: same as above, but for the mode asymmetry (α n, l ).
Other Images in This Article
Show More
Copyright and Terms & Conditions
© 2009. The American Astronomical Society. All rights reserved.