Image Details
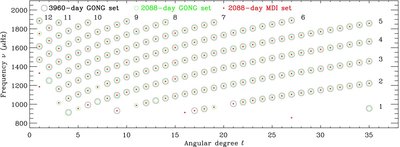
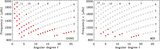
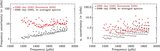
Caption: Figure 12.
l–ν diagram of the low-frequency solar p-modes from l = 1 up to l = 35 observed with the m-averaged spectrum technique in 3960 days of GONG observations (large black circles), and 2088 coeval days of the GONG (medium green circles) and MDI (red dots) observations. The ridges of same radial order are also indicated from n = 1 to n = 12.
Other Images in This Article
Show More
Copyright and Terms & Conditions
© 2009. The American Astronomical Society. All rights reserved.
Copyright ©
2025 Astronomy Image Explorer. All Rights Reserved.