Image Details
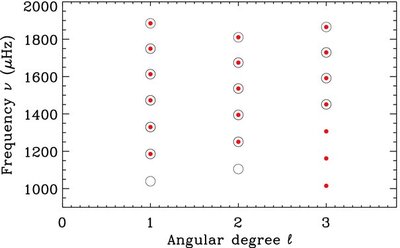
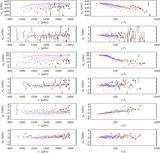
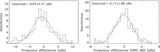
Caption: Figure 11.
l–ν diagram of the low-frequency, low-degree (1 ⩽ l ⩽ 3) modes measured with the integrated-light instruments GOLF and BiSON (open circles) by R. A. García, P. Boumier, and W. J. Chaplin (2007, private communications) and with the spatially resolved instruments GONG and MDI using the m-averaged spectrum technique (red dots), over comparable periods of time.
Other Images in This Article
Show More
Copyright and Terms & Conditions
© 2009. The American Astronomical Society. All rights reserved.
Copyright ©
2025 Astronomy Image Explorer. All Rights Reserved.