Image Details
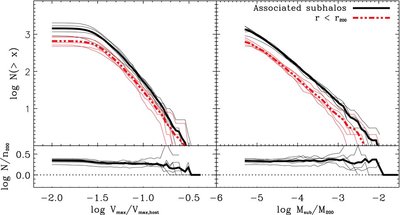
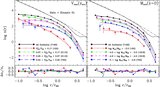
Caption: Figure 8.
Associated subhalo mass ( M sub) and peak circular velocity ( V max) cumulative distributions (both quantities measured at z = 0). Black lines correspond to all associated subhalos; red lines to subhalos identified within r 200. Thick lines in each panel denote the average of our five simulations. Note that the number of associated subhalos exceeds by about a factor of ~2 the number of subhalos found within r 200. The residuals are computed relative to the subhalo population within the virial radius.
Other Images in This Article
Copyright and Terms & Conditions
© 2009. The American Astronomical Society. All rights reserved.
Copyright ©
2025 Astronomy Image Explorer. All Rights Reserved.