Image Details
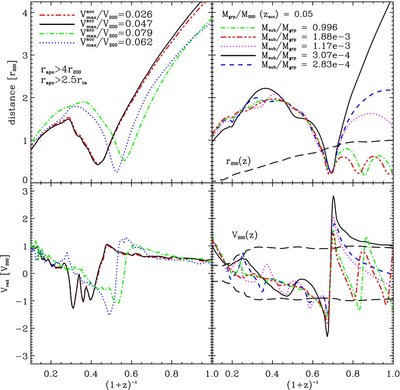
Caption: Figure 3.
Orbital trajectories of selected subhalos. Upper panels show the distance to the center of the main progenitor as a function of expansion factor. The top left panel shows the trajectories of four subhalos on "extreme" orbits (blue points in Figure 2). Note that all of these systems gain energy during their first pericentric approach to the main halo. The top right panel illustrates that interactions occurring during the tidal dissociation of bound groups of subhalos are responsible for propelling some satellites onto extreme orbits. At pericentric approach, the tidal field of the main halo breaks apart the group, and redistributes each member onto orbits of varying energy. The most affected are, on average, the least massive members of the group, some of which are pushed onto orbits with extremely large apocenters. The dashed curve shows the growth of the virial radius of the most massive progenitor of the main halo. Bottom panels show the radial velocity of the subhalos shown in the upper panels.
Other Images in This Article
Copyright and Terms & Conditions
© 2009. The American Astronomical Society. All rights reserved.