Image Details
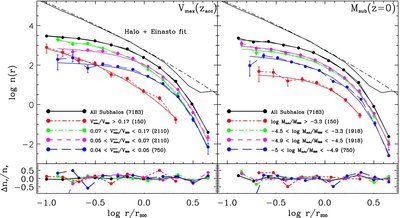
Caption: Figure 6.
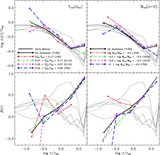
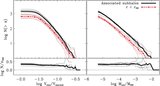
Number density profile of associated subhalos, after stacking the results of all five simulations in our series. The black solid symbols show the result for all subhalos, the other symbols correspond to various subsamples obtained after splitting by either V acc max (left panel) or by subhalo mass at z = 0 (right-hand panel). Details on the velocity and mass range for each subsample are given in the legend. Solid lines through each curve correspond to the best fits obtained with Equation (1). The parameters of each fit are listed in Table 2. Lines without symbols show the DM density profile. Note that the spatial distribution of subhalos depends sensitively on subhalo mass when measured by V acc max, but that, in agreement with prior work, the mass bias essentially disappears when adopting M sub to split the sample. See text for further discussion.
Other Images in This Article
Copyright and Terms & Conditions
© 2009. The American Astronomical Society. All rights reserved.