Image Details
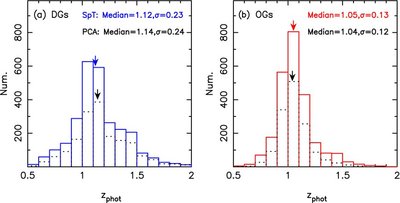
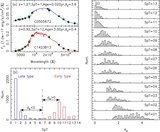
Caption: Figure 9.
Redshift distribution of EROs in our sample. Panel (a) shows DGs. Panel (b) shows OGs. The solid lines show the redshift distribution of DGs and OGs, which were classified by the SED fitting method; the dotted lines show the result by the PCA method.
Other Images in This Article
Show More
Copyright and Terms & Conditions
© 2009. The American Astronomical Society. All rights reserved.
Copyright ©
2025 Astronomy Image Explorer. All Rights Reserved.