Image Details
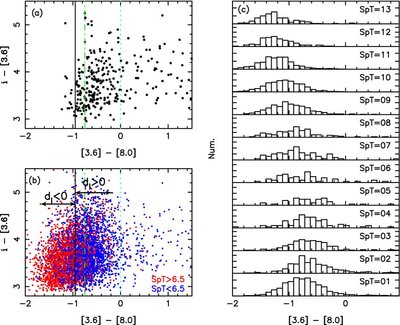
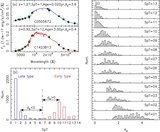
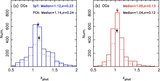
Caption: Figure 5.
i − [3.6] vs. [3.6] − [8.0] color–color diagram. (a) 325 EROs with MIPS 24 μm detection (DGs); (b) 4761 EROs in our sample
with the IRAC 3.6 and 8.0 μm detection. The dotted line and dot-dashed line show the color criteria were used in Wilson et al.
(2007), to classify EROs into OGs, DGs, and AGNs. The solid line, [3.6] − [8.0] = −0.95, was used to classify EROs into OGs
and DGs in our works. Red symbols indicate EROs with
 , and were classified as OGs with the SED fitting method; and blue symbols are EROs with
 .
d
I
= [3.6] − [8.0] − (−0.95) is the distance from an object at
i − [3.6] vs. [3.6] − [8.0] diagram to the [3.6] − [8.0] = −0.95 line. (c) [3.6] − [8.0] distribution for EROs with different
.
d
I
= [3.6] − [8.0] − (−0.95) is the distance from an object at
i − [3.6] vs. [3.6] − [8.0] diagram to the [3.6] − [8.0] = −0.95 line. (c) [3.6] − [8.0] distribution for EROs with different
 .
.
Other Images in This Article
Show More
Copyright and Terms & Conditions
© 2009. The American Astronomical Society. All rights reserved.