Image Details
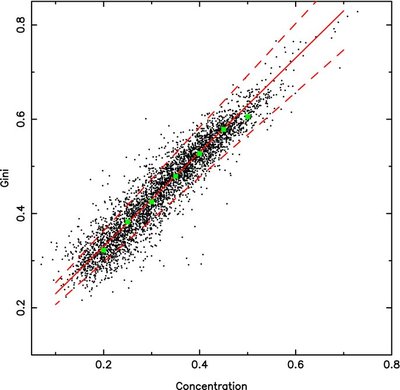
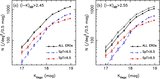
Caption: Figure 6.
Gini coefficient ( G) vs. central concentration ( C) for EROs. The solid line corresponds to unity slope, the big squares show the median value of G at different C bins, from 0.2 to 0.55. The dashed lines are ±10% offset relative to the solid line.
Other Images in This Article
Show More
Copyright and Terms & Conditions
© 2009. The American Astronomical Society. All rights reserved.
Copyright ©
2025 Astronomy Image Explorer. All Rights Reserved.