Image Details
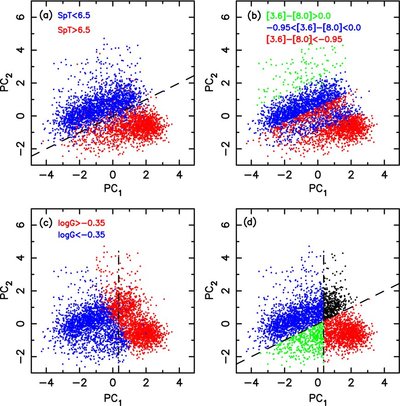
Caption: Figure 8.
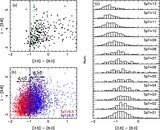
Plot of PC
1 vs. PC
2 for EROs in our sample. (a) EROs are colored with
 ,
,
 (OGs) are red, DGs are blue. (b) [3.6] − [8.0] < −0.95, [3.6] − [8.0]>0.0, and −0.95 < [3.6] − [8.0] < 0.0 are colored as
red, green, and blue, respectively. (c) log
G > − 0.35 (OGs) are plotted as red and DGs as blue. (d) EROs are colored with the best-separated line from panel (a) and panel
(c).
(OGs) are red, DGs are blue. (b) [3.6] − [8.0] < −0.95, [3.6] − [8.0]>0.0, and −0.95 < [3.6] − [8.0] < 0.0 are colored as
red, green, and blue, respectively. (c) log
G > − 0.35 (OGs) are plotted as red and DGs as blue. (d) EROs are colored with the best-separated line from panel (a) and panel
(c).
Other Images in This Article
Show More
Copyright and Terms & Conditions
© 2009. The American Astronomical Society. All rights reserved.
Copyright ©
2025 Astronomy Image Explorer. All Rights Reserved.