Image Details
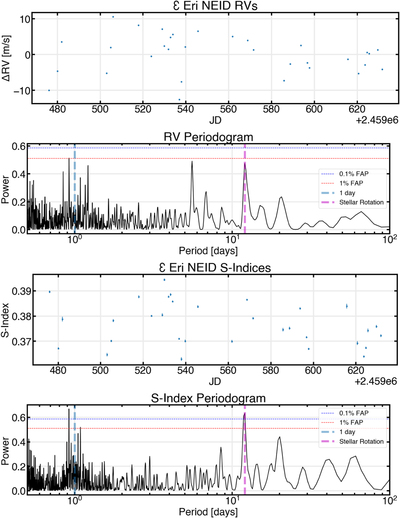
Caption: Figure 6.
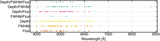
Time series of the measured RVs and S-indices and corresponding periodograms for each NEID observation used in our analysis. In the RV time series, we subtract the systematic RV of ϵ Eri, 16.49 km s−1, and plot the Δ RVs. Both periodograms display a peak at ∼11 days, the rotational period of the star (Howard & Fulton 2016; Mawet et al. 2019).
Other Images in This Article

Copyright and Terms & Conditions
© 2023. The Author(s). Published by the American Astronomical Society.
Copyright ©
2025 Astronomy Image Explorer. All Rights Reserved.