Image Details
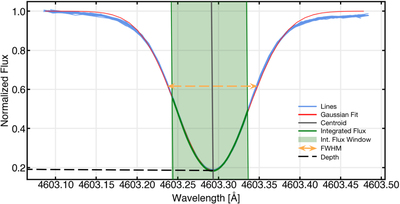
Caption: Figure 1.
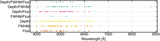
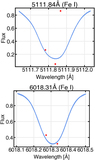
Example of how we fit each line (blue) with a standard Gaussian function (red) and extract all line parameters. The centroid, depth, and FWHM of the line are measured from the Gaussian fit. The range over which we calculate integrated flux in this example line is denoted in green. Note that the exact wavelength bounds of this region vary slightly from line to line since our integrated flux window is uniform in velocity, not wavelength, though on average the integrated flux window captures a similarly wide region of each line around the line core as shown in this figure.
Other Images in This Article


Copyright and Terms & Conditions
© 2023. The Author(s). Published by the American Astronomical Society.
Copyright ©
2025 Astronomy Image Explorer. All Rights Reserved.