Image Details
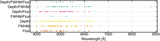
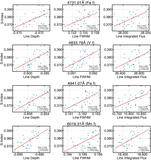
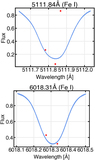
Caption: Figure 2.
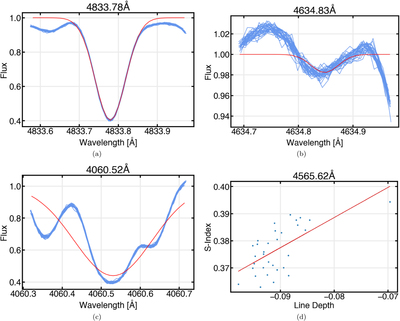
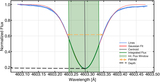
Examples of the visual criteria we used to prune our line lists. We determine whether or not to remove a line based on whether the Gaussian fit appears to accurately fit and measure a line’s parameters, and if the correlations appear to exhibit a significant outlier that skews the correlation. (a) An example of a “good” line that we do not remove, since the Gaussian fit appears to match the line within its wings. (b) An example of a noisy line such that the Gaussian fit does not accurately fit the line. (c) An example of a blended line with multiple peaks in the fitting window, such that the Gaussian fit does not accurately fit the line. (d) An example of a line whose plot correlating line depth with the S-index exhibits a significant outlier that skews the best-fit line.
Other Images in This Article


Copyright and Terms & Conditions
© 2023. The Author(s). Published by the American Astronomical Society.