Image Details
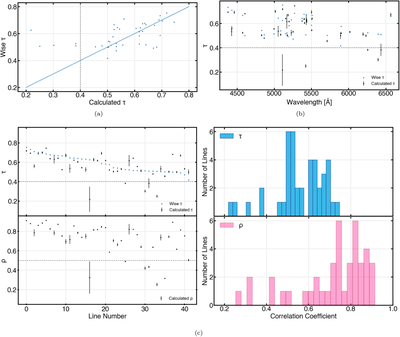
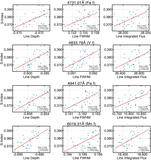
Caption: Figure 3.
Results of our analysis of the Wise line list using our partially automated method and NEID ϵ Eri spectra. In these graphs, the ∣τ∣ and ∣ρ∣ values are for the correlation between line core flux/depth and S-index. (a) ∣τ∣ values for each line in the Wise line list calculated by Wise et al. (2018; “W18”) plotted against the ∣τ∣ values we calculated for the same lines using NEID data of ϵ Eri. The 1:1 line is marked in blue, and our threshold for correlation in ∣τ∣ is marked in gray. Five lines did not meet our threshold for correlation in ∣τ∣. (b) Both our and W18's ∣τ∣ values for each line in the Wise line list, organized by wavelength. Our threshold for correlation in ∣τ∣ is marked in gray. (c) Both our and W18's ∣τ∣ values and our ∣ρ∣ values (W18 did not calculate ∣ρ∣) for each line in the Wise line list, organized by line number in descending order of ∣τ∣ values calculated by W18, and the corresponding histograms. Our thresholds for correlation in ∣τ∣ and ∣ρ∣ respectively are marked in gray. In addition to the lines that did not meet our threshold for correlation in ∣τ∣, one line was found to meet our threshold for correlation in ∣τ∣, but not ∣ρ∣. The corresponding histograms show the ∣τ∣ and ∣ρ∣ values we calculated for correlations between line depth and S-index for the Wise line list. ∣ρ∣ values are consistently higher than corresponding ∣τ∣ values for the same line.
Other Images in This Article


Copyright and Terms & Conditions
© 2023. The Author(s). Published by the American Astronomical Society.