Image Details
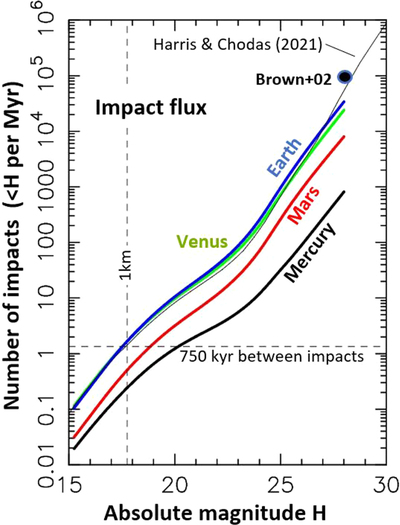
Caption: Figure 23.
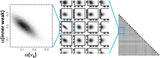
The impact flux on the terrestrial planets as function of NEOs absolute magnitude. The black, green, blue, and red lines show the impact flux for Mercury, Venus, Earth, and Mars, respectively, from Equation (13). The thin solid line near the Earth flux is the NEO magnitude distribution from Harris & Chodas (2021) scaled with the fixed impact probability (1.5 × 10⁻³ Myr−1; see the main text). The black dot approximately marks the constraint from bolide detonations in the Earth atmosphere (Brown et al. 2002). The horizontal dashed line shows the impact flux for D > 1 km bodies from Morbidelli et al. (2020; 0.75 Myr average spacing between impacts). The vertical dashed line corresponds to H = 17.75.
Other Images in This Article

Show More
Copyright and Terms & Conditions
© 2023. The Author(s). Published by the American Astronomical Society.