Image Details
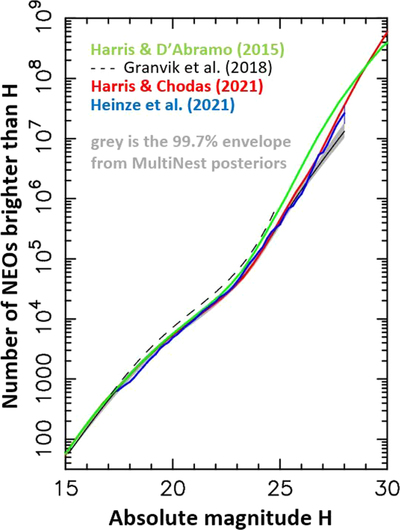
Caption: Figure 22.
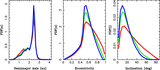
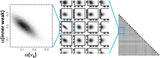
The (intrinsic) absolute magnitude distribution from the modified base model where we extended the model domain to 15 < H < 28 (solid black line). The gray area shows the 99.7% envelope of posteriors from the MultiNest fit. For reference, we also plot the magnitude distributions from Harris & D’Abramo (2015; green line), Granvik et al. (2018; dashed black line for 17 < H < 25), Harris & Chodas (2021; red line), and Heinze et al. (2021; blue line). Note that the vertical blue bar at H = 28 shows the 1σ uncertainty reported in Heinze et al. (2021) for the number of NEO with H < 28.
Other Images in This Article

Show More
Copyright and Terms & Conditions
© 2023. The Author(s). Published by the American Astronomical Society.
Copyright ©
2025 Astronomy Image Explorer. All Rights Reserved.