Image Details
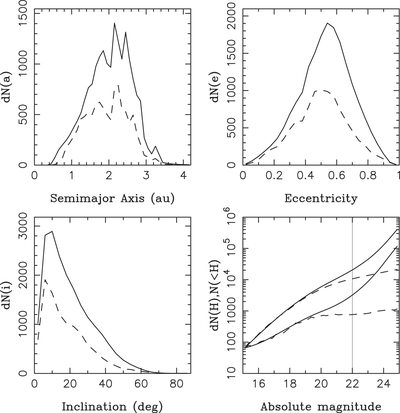
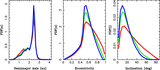
Caption: Figure 17.
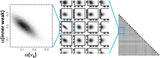
The incompleteness of the known NEO population. For the a, e, and i distributions, the dashed lines show the number of known NEOs with H < 22, and the solid lines are the number of NEOs with H < 22 inferred from our maximum likelihood base model (both given per bin interval; 0.1 au, 0.°04, and 4°). For the H distribution in the bottom-right panel, we show both the cumulative and differential (per 0.25 mag) distributions (upper and lower lines, respectively; solid for model, dashed for known). The uncertainty of the cumulative population estimates increases from ≃3% for H < 20 to ≃6% for H < 25. The uncertainties were obtained from the posterior distribution produced by MultiNest and do not account for various uncertainties of the CSS detection efficiency.
Other Images in This Article

Show More
Copyright and Terms & Conditions
© 2023. The Author(s). Published by the American Astronomical Society.