Image Details
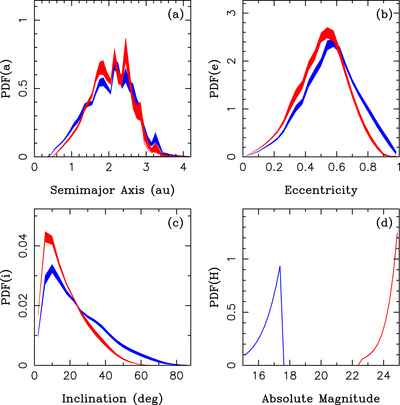
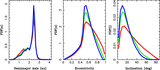
Caption: Figure 16.
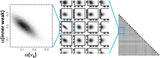
The PDFs of a, e, i, and H from the intrinsic (debiased) base model. The plot compares the distributions of bright NEOs with 15 < H < 17.5 (blue) and faint NEOs with 22.5 < H < 25 (red). The blue and red shaded areas are the 1σ envelopes of our base model posteriors.
Other Images in This Article

Show More
Copyright and Terms & Conditions
© 2023. The Author(s). Published by the American Astronomical Society.
Copyright ©
2025 Astronomy Image Explorer. All Rights Reserved.