Image Details
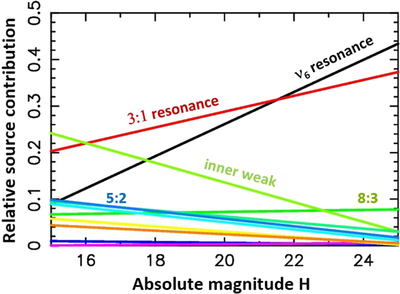
Caption: Figure 14.
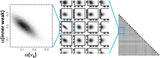
The contribution of different NEO sources as a function of the absolute magnitude. The ν 6 and 3:1 resonances are shown by the black and red lines, respectively. The light-green line is the contribution of weak resonances in the inner main belt. The plot shows the result for the maximum likelihood parameter set from the base model. We simply plot α j (15) and α j (25) for each source and connect them by a straight line (Section 5.1). The uncertainties of α j (15) and α j (25) are listed in Table 3.
Other Images in This Article

Show More
Copyright and Terms & Conditions
© 2023. The Author(s). Published by the American Astronomical Society.