Image Details
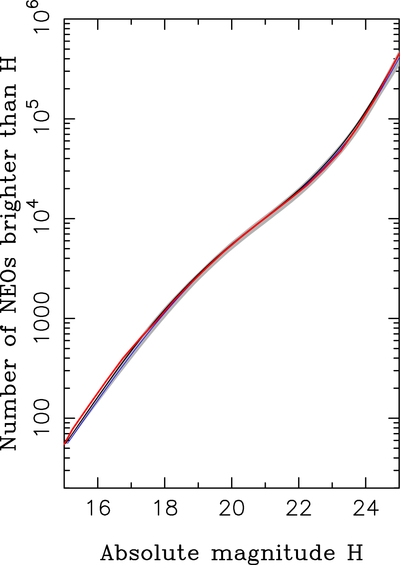
Caption: Figure 13.
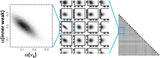
The intrinsic (debiased) absolute magnitude distribution of NEOs from our base model (the black line is the median and the blue line is the best fit) is compared to the magnitude distribution from Harris & Chodas (2021; red line). The gray area is the 3σ envelope obtained from the posterior distribution computed by MultiNest. It contains—by definition—99.7% of our base model posteriors.
Other Images in This Article

Show More
Copyright and Terms & Conditions
© 2023. The Author(s). Published by the American Astronomical Society.
Copyright ©
2025 Astronomy Image Explorer. All Rights Reserved.