Image Details

Caption: Figure 40.
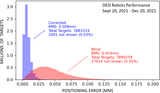
The magnitude of the centroiding variance when the turbulence is high (left) and low (right). The highest turbulence occurs when the DESI focal plane is imaged with the dome closed, mirror cooling fans running, and the dome air temperature very different from the mirror temperature. The lowest turbulence occurs with the dome open, cooling fans off, and the mirror temperature matching the air temperature. The small dots in these maps show the location of each measured source in the FVC image (∼5500 sources). The brightness of each dot scales with the variance of the respective source position, determined from 10 repeated observations over a short time interval. Only the variance in the horizontal direction is represented, but the variance in the vertical direction is similar. The high turbulence map shows regions in the image where the variance is as high as 50 millipixels (∼160 μm pixel−1 at the focal surface), depending on the location in the field. The median is 30 millipixels. When the turbulence is low, the peak and median variance fall to 30 and 18 millipixels, respectively.
Other Images in This Article

Show More
Copyright and Terms & Conditions
© 2022. The Author(s). Published by the American Astronomical Society.