Image Details
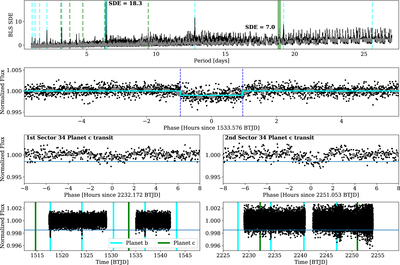
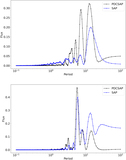
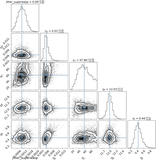
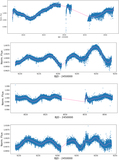
Caption: Figure 8.
Top: joint BLS periodograms of the Sector 8 and 34 TESS light curves, before (black) after (gray) removing the transits of TOI 506 b, plotted as a function of period in days with the BLS standard deviation statistical significance power on the vertical axis (SDE). The periods of b and c are indicated as teal and green shaded regions, respectively. The vertical dashed lines correspond to integer (2x, 3x, 4x, etc.) and integer fraction (1/2, 1/3x, 1/4x, etc.) multiples of these periods in teal and green for b and c, respectively, as well. Note that the time units of BTJD are BJD-2457000.0 days. Second row: phased light curve for the two transits of TOI 560 c in the Sector 34 TESS light curve as unbinned black and binned (one hour) gray dots, plotted as a function of time in hours on the horizontal axis with respect to the transit conjunction time, and the normalized flux on the vertical axis. A teal transit model is overlaid. The blue dashed vertical lines correspond to the time of conjunction and transit ingress and egress. Third row: same as the second row, but the individual transits of TOI 560 c are plotted separately. Fourth row: the Sector 8 (left) and 34 (right) light curve of TOI 560, where the transit times of TOI 560 b and c are marked in teal and green, respectively, plotted as a function of time and normalized flux. This shows that TESS just missed observing TOI 560 c during this initial sector. The horizontal blue line is a line corresponding to 2 ppt, the approximate depth for TOI 560 c.
Other Images in This Article
Show More
Copyright and Terms & Conditions
© 2022. The Author(s). Published by the American Astronomical Society.