Image Details
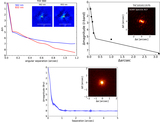
Caption: Figure 3.
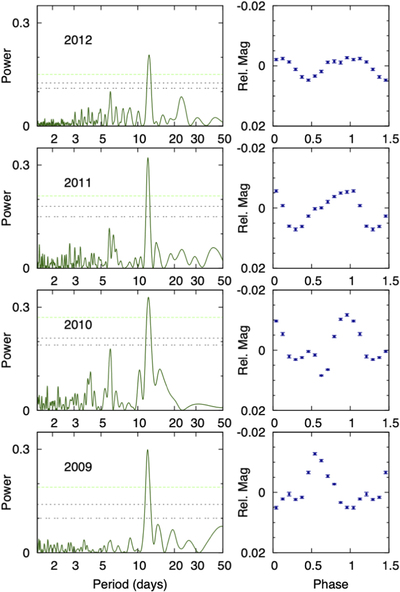
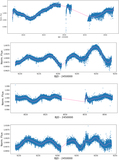
Left panels: Lomb-Scargle periodograms of the light curves of TOI 560 from the SuperWASP survey in 2009–2012 from bottom to top, plotted in green as a function of period on the horizontal axis and power on the vertical axis. Right panels: phased seasonal light curves of the SuperWASP TOI 560 seasonal light curves in the same reverse annual order. The light curves are binned in phase in 0.05 increments in blue with the coadded uncertainties shown, with rotational phase on the horizontal axis and relative and normalized apparent magnitude on the vertical axis. Spot evolution is readily apparent from year to year, including some double-humped features from spots on the northern and southern hemispheres of the star.
Other Images in This Article
Show More
Copyright and Terms & Conditions
© 2022. The Author(s). Published by the American Astronomical Society.