Image Details
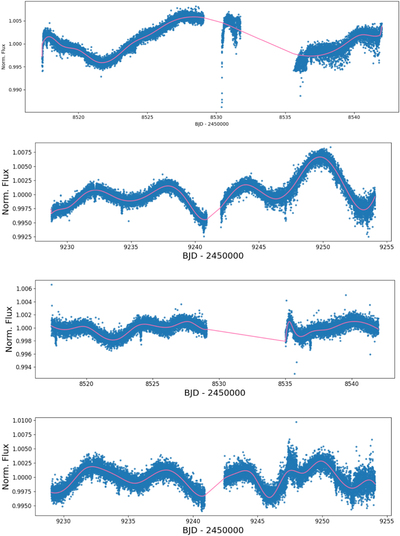
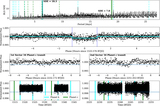
Caption: Figure 10.
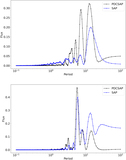
The TESS SAP (top two) and PDC-SAP (two bottom) light curves of TOI 560 from Sectors 8 and 34, plotting the normalized flux on the vertical axes as a function of time on the horizontal axes. The light curves are shown as blue data points, and the cubic-spline regression is shown as the pink line. The interpolation in the data gap downlink region in the middle of each sector is subsequently discarded in our analysis. Significant photometric modulation due to stellar activity is apparent in both sectors.
Other Images in This Article
Show More
Copyright and Terms & Conditions
© 2022. The Author(s). Published by the American Astronomical Society.
Copyright ©
2025 Astronomy Image Explorer. All Rights Reserved.