Image Details
Caption: Figure 39.
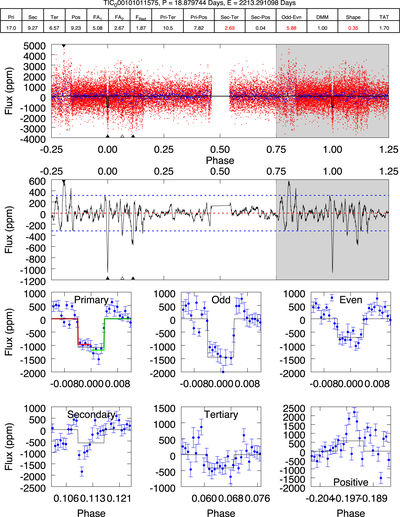
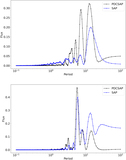
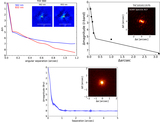
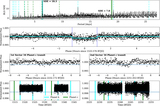
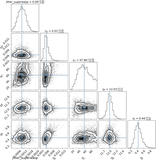
Sector 34: full transit data (top), convolved (middle), and different phased scenarios (bottom, labeled) showing primary, odd, even, secondary, tertiary, and positive transits. The table on top show the DV Model-Shift Uniqueness Test. The top line shows the TCE ID and associated orbital period and epoch. The value of Sec-Ter appears red because Sec-Ter < FA2. The value of Odd-Evn appears in red because Odd-Evn > FA1. The value of “Shape” appears in red if it is >0.3.
Other Images in This Article
Show More
Copyright and Terms & Conditions
© 2022. The Author(s). Published by the American Astronomical Society.
Copyright ©
2025 Astronomy Image Explorer. All Rights Reserved.