Image Details
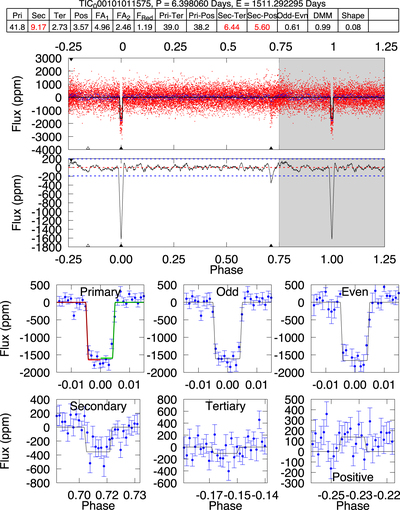
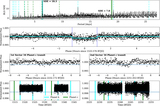
Caption: Figure 38.
Sector 8: full transit data (top), convolved (middle), and different phased scenarios (bottom, labeled) showing primary, odd, even, secondary, tertiary, and positive transits. The table on top show the DV Model-Shift Uniqueness Test. The top line shows the TCE ID and associated orbital period and epoch. The table lists the values for the significances of each event (Pri = primary, Sec = secondary, Ter = tertiary, and Pos = positive), the false-alarm detection thresholds (FA1 and FA2), and the ratio of the noise level on the timescale of the transit duration (red noise) divided by the Gaussian noise (Fred). The difference in significance between the primary and tertiary events (Pri-Ter), the primary and positive events (Pri-Pos), the secondary and tertiary events (SecTer), the secondary and positive events (Sec-Pos), and odd- and even-numbered events (Odd-Evn) are listed next. Finally the values for the depth mean-to-median (DMM), Shape, and the transit asymmetry test (TAT) tests are shown.
Other Images in This Article
Show More
Copyright and Terms & Conditions
© 2022. The Author(s). Published by the American Astronomical Society.