Image Details
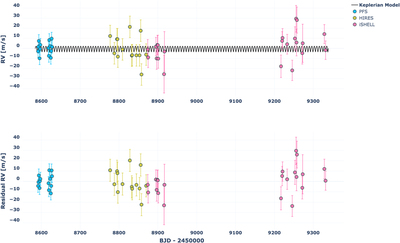
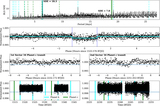
Caption: Figure 29.
Full RV time-series plot, with the black line representing our Keplerian model of the b and c planets. Pink, yellow, and blue data points are nightly iSHELL, HIRES, and PFS RVs, respectively. The top plot shows the RVs over the full time baseline of observations, while the bottom plot shows the residuals (data − model).
Other Images in This Article
Show More
Copyright and Terms & Conditions
© 2022. The Author(s). Published by the American Astronomical Society.
Copyright ©
2025 Astronomy Image Explorer. All Rights Reserved.