Image Details
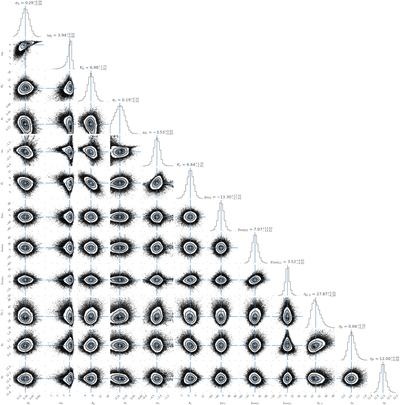
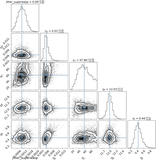
Caption: Figure 19.
MCMC cornerplot for our joint chromatic GP kernel J 2 RV model. Posterior distributions are along the diagonal, and two-parameter covariances are shown off the diagonal. The model parameter median and 68% confidence interval ranges are displayed at the top of each posterior distribution; median values are also indicated with horizontal and vertical blue lines for the covariance plots, and vertical lines for the posterior distribution. For the covariance plots, 1σ, 2σ, and 3σ contours are shown in place of the individual sample values <3σ from the medians.
Other Images in This Article
Show More
Copyright and Terms & Conditions
© 2022. The Author(s). Published by the American Astronomical Society.
Copyright ©
2025 Astronomy Image Explorer. All Rights Reserved.