Image Details
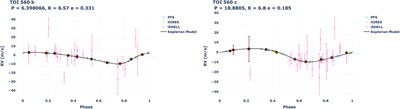
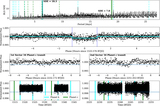
Caption: Figure 18.
Phased RV time-series plot for the joint chromatic GP kernel J 2 model, with orbital phase on the horizontal axis and RV on the vertical axis in meters per second. The left panel is phased to TOI 560 b, and the right panel TOI 560 c. RV measurements, after subtracting the best-fit GP are shown as small colored circles for each RV spectrograph. The maroon points are binned RVs every 0.1 in orbital phase. The best-fit MAP Keplerian model is shown as the black curve, with a fixed circular orbit, velocity semiamplitude K, and orbital period P indicated.
Other Images in This Article
Show More
Copyright and Terms & Conditions
© 2022. The Author(s). Published by the American Astronomical Society.
Copyright ©
2025 Astronomy Image Explorer. All Rights Reserved.