Image Details
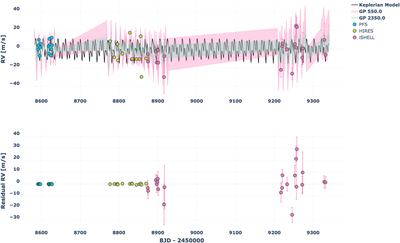
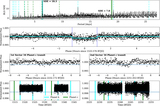
Caption: Figure 17.
Full RV time-series plot for the joint chromatic GP kernel J 2 model, with time in BJD on the horizontal axis and RV on the vertical axis in meters per second. RV measurements are shown as colored circles for each RV spectrograph. The black solid line is the Keplerian best-fit MAP model for TOIs 560 b and c. The shaded regions are the chromatic GP 1σ uncertainty regions from realizations of the J 2 covariance kernel, with the PFS and HIRES sharing the same GP at 550 nm, and a marginally smaller GP amplitude in the NIR for iSHELL. Residuals (data – model) are shown in the lower plot.
Other Images in This Article
Show More
Copyright and Terms & Conditions
© 2022. The Author(s). Published by the American Astronomical Society.