Image Details
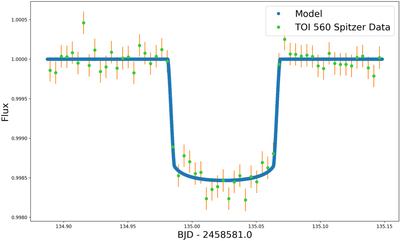
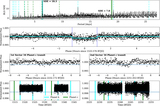
Caption: Figure 16.
The Spitzer light curve for TOI 560, with normalized flux plotted as a function of time since mid-transit. The Spitzer data points are binned for clarity, and overlaid with a transit model independently fit in blue.
Other Images in This Article
Show More
Copyright and Terms & Conditions
© 2022. The Author(s). Published by the American Astronomical Society.
Copyright ©
2025 Astronomy Image Explorer. All Rights Reserved.