Image Details
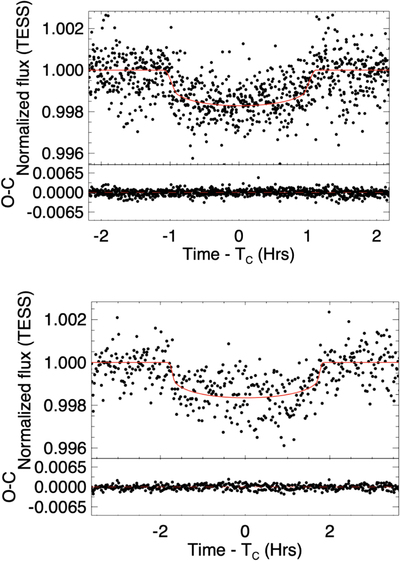
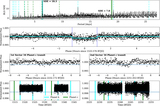
Caption: Figure 14.
TOI 560 b (top) and TOI 560 c (bottom) TESS phase-folded transit light curves, plotted as normalized flux as a function of time since transit conjunction in hours on the horizontal axis. The median MCMC transit models are overlaid as red lines. The bottom panel show the median-model subtracted residuals.
Other Images in This Article
Show More
Copyright and Terms & Conditions
© 2022. The Author(s). Published by the American Astronomical Society.
Copyright ©
2025 Astronomy Image Explorer. All Rights Reserved.