Image Details
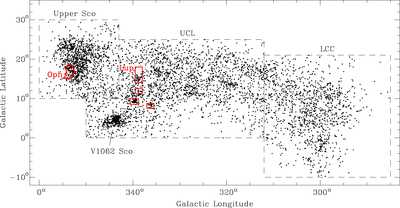
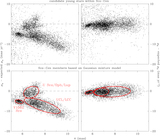
Caption: Figure 5.
Spatial distribution of the candidate members of Sco–Cen with >90% membership probabilities from Figure 4. The boundaries from de Zeeuw et al. (1999) for the subgroups are indicated (dashed lines). We also have marked the boundary between Upper Sco and Ophiuchus from Esplin et al. (2018) and rectangles that encompass clouds 1–4 in Lupus (solid red lines).
Other Images in This Article
Show More
Copyright and Terms & Conditions
© 2020. The American Astronomical Society. All rights reserved.
Copyright ©
2026 Astronomy Image Explorer. All Rights Reserved.