Image Details
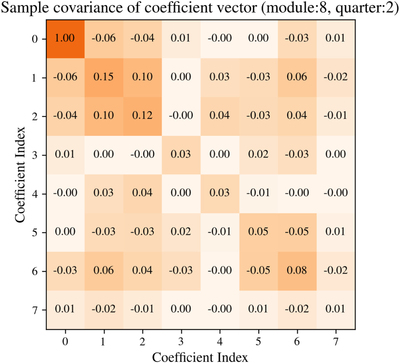
Caption: Figure 4.
Normalized sample covariance of coefficient value estimates ﹩\left\{{\hat{{\boldsymbol{c}}}}_{i}:i\in I\right\}﹩ obtained from least-squares fits of {﹩{{\boldsymbol{v}}}_{k}﹩ : k ∈ K} to light curves {﹩{{\boldsymbol{y}}}_{i}﹩ : i ∈ I}. These data are from the Kepler CCD module 8 during quarter 2. The c0 variance indicates that {﹩{{\boldsymbol{v}}}_{0}﹩} is a dominant systematic trend across the light-curve population. Correlations are also observed between basis signals. For ease of presentation, the covariance is only shown for 8 of 20 coefficient values and has been normalized by dividing the matrix by the maximum value.
Other Images in This Article
Copyright and Terms & Conditions
© 2020. The American Astronomical Society. All rights reserved.