Image Details
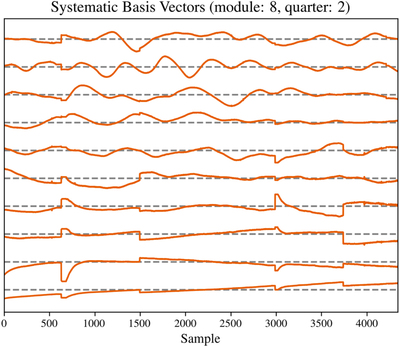
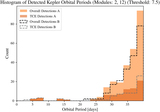
Caption: Figure 2.
A sample of 10 (out of model order K = 20) systematic basis vectors {﹩{{\boldsymbol{v}}}_{k}﹩} obtained using PCA for data from CCD module 8 during Kepler observing quarter 2. The basis vectors are ordered by principal value increasing from bottom to top. The x-axis denotes the Kepler long-cadence time sample index (﹩\bigtriangleup t=29.4\ \mathrm{minutes}﹩). The y-axis is a uniform normalized zero-mean amplitude scale and is not annotated explicitly accordingly.
Other Images in This Article

Copyright and Terms & Conditions
© 2020. The American Astronomical Society. All rights reserved.
Copyright ©
2025 Astronomy Image Explorer. All Rights Reserved.