Image Details
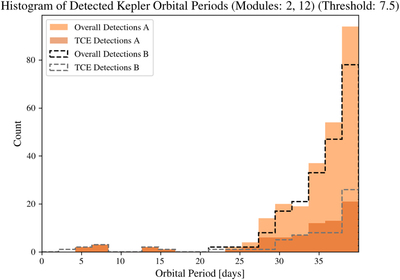
Caption: Figure 10.
Histogram of detected Kepler orbital periods from a sample of 2000 light curves selected from CCD modules 2 and 12. Results for detectors A and B are shown as indicated. Those detections that are also TCEs are marked.
Other Images in This Article

Copyright and Terms & Conditions
© 2020. The American Astronomical Society. All rights reserved.
Copyright ©
2025 Astronomy Image Explorer. All Rights Reserved.