Image Details
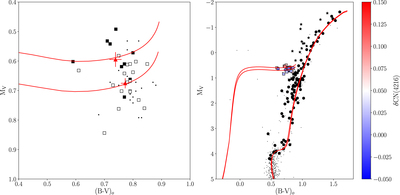
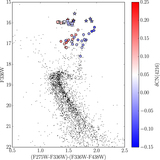
Caption: Figure 7.
Left Panel: CMD for M71 centered on the HB with MV versus (B–V)o (photometry from Cudworth 1985 and private communication). Small dots indicate HB stars (determined based on their position in the CMD) that have an 85% probability of membership determined by Cudworth (1985 and private communication) that were not measured for CN strength. HB stars are indicated as squares with open squares being CN-normal and filled being CN-enhanced following the same classification as shown in Figure 6. Average positions of each population are shown as red triangles with error bars indicating the mean errors. Red lines show the two ZAHBs that best fit these positions. Right Panel CMD of M71 with HB stars indicated as colored squares color-coded based on their δCN(4216) band strength, as indicated by the color bar to the right. Black circles are RGB stars, and stars are AGB stars. Overplotted are red lines showing the ZAHBs from the left panel, as well as isochrones generated with the same parameters using the PGPUC isochrone interpolator.
Other Images in This Article

Copyright and Terms & Conditions
© 2020. The American Astronomical Society. All rights reserved.