Image Details
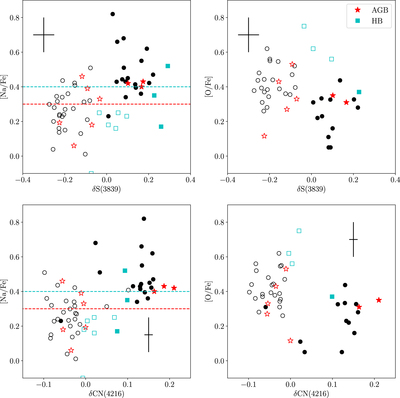
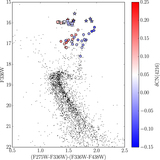
Caption: Figure 9.
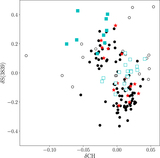
Top Left: [Na/Fe] versus δS(3839) for all stars in our sample with [Na/Fe] measurements. A red dashed line is placed where the division in populations is defined for [Na/Fe] (Carretta et al. 2009a, 2009b). A blue dashed line shows the separation in [Na/Fe] increased by 0.1 dex. Top Right: [O/Fe] versus δS(3839) for all stars in our sample with [O/Fe] measurements. Bottom Row: the same as the top row except for δCN(4216) instead of δS(3839). In all panels, symbols are coded as in Figure 1, CN-enhanced stars are filled, and CN-normal stars are open.
Other Images in This Article

Copyright and Terms & Conditions
© 2020. The American Astronomical Society. All rights reserved.
Copyright ©
2026 Astronomy Image Explorer. All Rights Reserved.