Image Details
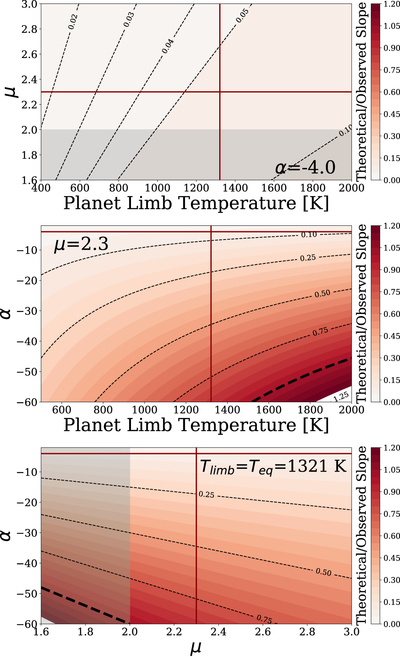
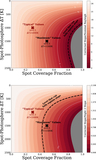
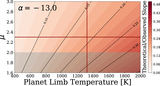
Caption: Figure 8.
For all frames we show the theoretical Rayleigh slopes (see Equation (5)) divided by the combined measured slope, assuming a clear atmosphere. The thick dashed black line denotes the values that can explain the measured slope (if possible). Dark red lines represent the nominal values. The shaded gray region denotes values of μ which are unphysical for these temperatures. Top: for a constant α and a range of planet limb temperatures and mean molecular weights. For a suitable range of these parameters, we find no combination that can explain our measured slope. Middle: for a constant mean molecular weight of 2.3 (a value typical of Jupiter) and a range of planet limb temperatures and α. For Tlimb = Teq ≈ 1325 K, an α ≈ −35 would match the data. Bottom: for a constant limb temperature set to the equilibrium temperature and a range of α and μ values. The slope is not strongly sensitive to the mean molecular weight, but low values of μ allow for lower α values.
Other Images in This Article
Copyright and Terms & Conditions
© 2019. The American Astronomical Society. All rights reserved.