Image Details
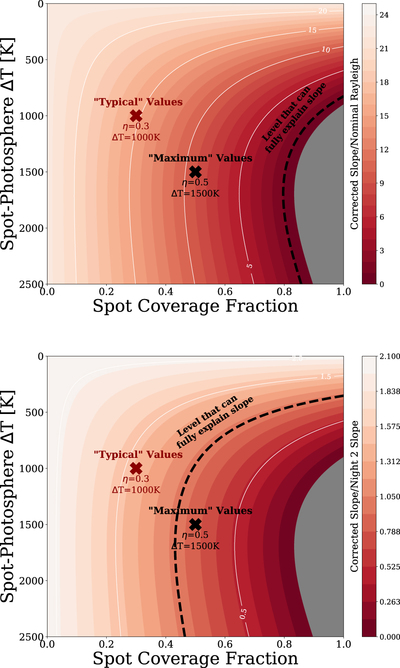
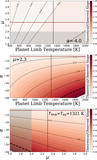
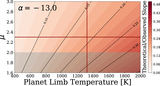
Caption: Figure 7.
Equation (6) applied to our observed slope for a variety of spot contrast and spot coverage fractions. Top: the corrected slope is divided by the nominal Rayleigh slope. Bottom: the corrected slope is divided by the night two slope. In both panels, The black dashed line denotes the level that would correct our data back onto the nominal Rayleigh slope or night two slope, at a ratio of 1. The higher the value, the further the corrected slope is from the goal slope. We also mark with a red “X” a representative typical set of values and a black “X” the maximum spot coverage and ΔT we consider in this work; these are the same values on both panels. The shaded gray regions result in a positive slope, and so are considered unallowed. Regardless, it is highly unlikely that a star would have such a high spot coverage and ΔT. We are unable to correct the slope back onto the nominal Rayleigh through unocculted spots alone as demonstrated in the top panel, but we can explain the difference between the two nights.
Other Images in This Article
Copyright and Terms & Conditions
© 2019. The American Astronomical Society. All rights reserved.