Image Details
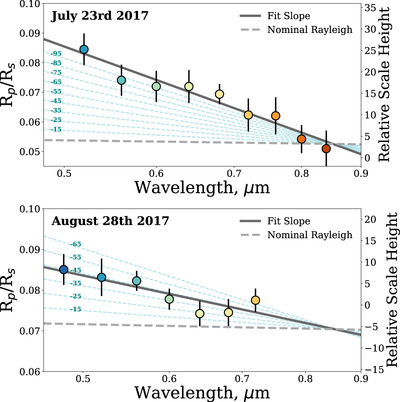
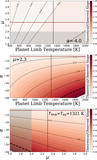
Caption: Figure 6.
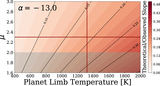
Top: night one (2017 July 23) transmission spectrum. Bottom: night two (2017 August 11) transmission spectrum. The two nights are plotted separately due to differences in the measured scattering slope. On both panels, the vertical green dashed line at 5890 Å is where we would expect sodium absorption, while the orange dashed line at 7665 Å is where we would expect potassium absorption if they were present (though the features would not show up at the wide binning plotted here). The dashed gray line is the nominal Rayleigh slope and the solid gray line is the fit slope. Both panels include the same slopes for varying α parameters in blue for easy comparison of the two nights. The nominal Rayleigh slope has α = −4, Tlimb = Teq (1321 K), μ = 2.3, and g = gplanet (464.51 cm s−2).
Other Images in This Article
Copyright and Terms & Conditions
© 2019. The American Astronomical Society. All rights reserved.